16 million more passengers use public transport in 2017
The National Transport Authority today (5th January 2018) published full-year figures (preliminary) for each of the state-supported public transport operators for 2017.
251,000,000 passenger journeys were provided by Dublin Bus, Bus Éireann, Iarnród Éireann and Luas on their Public Service Obligation services in 2017. That’s an increase of over 16m, or 7% compared to 2016.
The performance by Dublin Bus has been very strong and the company provided the largest number of passenger journeys in 2017 at over 136m. This represents an increase of more than 9% over 2016 and represents four straight years of passenger growth.
Iarnród Éireann saw passenger journeys increase from 42.8m to 45.5m, an increase of over 6%. The company is benefitting from continued economic growth and has seen demand increasing across the network. The introduction of new services, such as those through the Phoenix Park Tunnel have helped passenger numbers continue to expand.
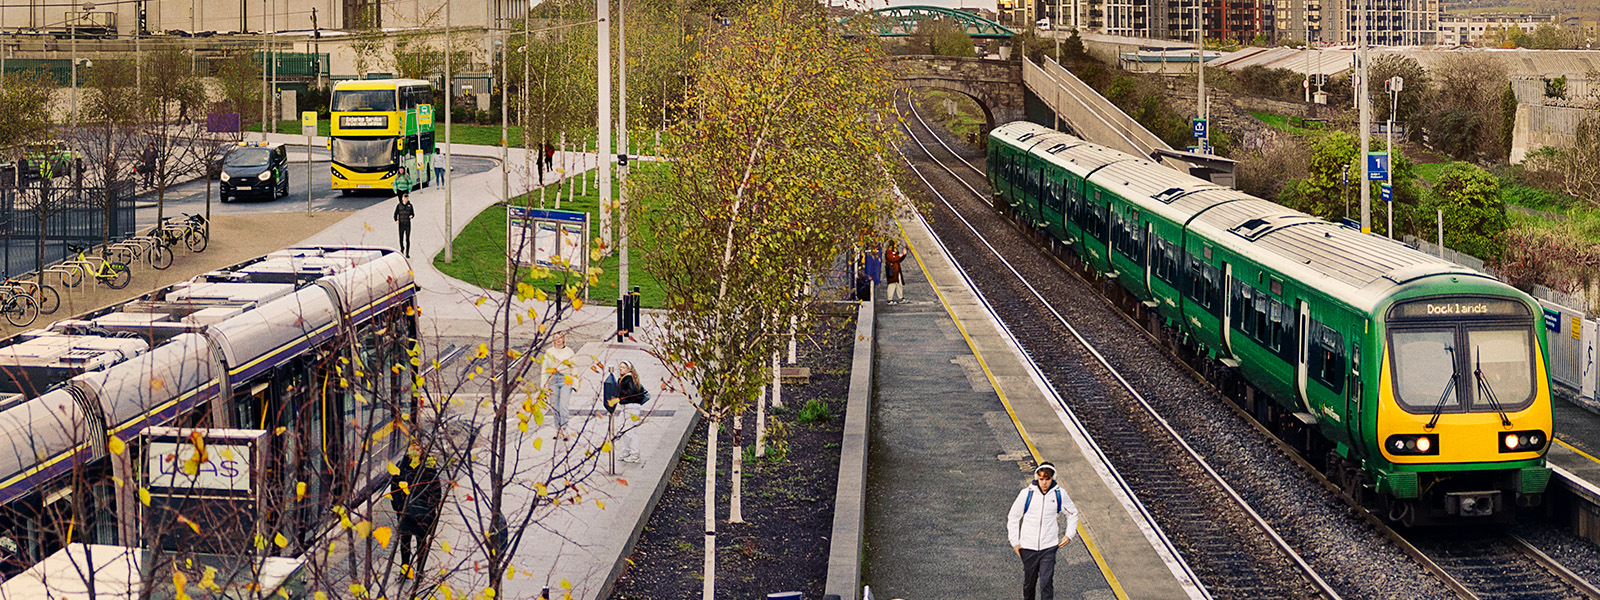
Numbers on Luas increased by 10.26% to 37.6m, in 2017. With the Green Line now extended to Broombridge, and providing interchange with the Red Line and greater connectivity to rail services, those numbers are likely to grow substantially again in 2018.
Bus Éireann figures for 2017 are 31.2m – down on last year’s 32.1m – but that’s mainly as a result of the industrial action which lasted three full weeks. On a like-for-like basis the annual number of passenger journeys is up 2.6% in 2017.
Anne Graham, CEO of the National Transport Authority said: “2017 was another year of strong growth in public transport, and the role of the operators and their staff should be acknowledged in that regard.
“Today’s figures are a further indication of a clear demand for safe, efficient and reliable public transport services. Particularly so when the public transport alternative is environmentally friendly and offers value for money.
“But we cannot rest on our laurels, and 2018 will be another busy year for the public transport sector. In order to meet this increased demand, seven new 55-meter trams will be introduced on the Green Luas line between January and March adding over 2,500 person capacity to the line.
“Iarnród Éireann will be introducing a 10-minute frequency on DART services, additional off-peak services on the Maynooth line, an additional service in each direction on the Sligo line and new off-peak services on the Kildare line operating through the Phoenix Park tunnel.
“In terms of bus services in the capital, Dublin Bus will increase capacity for peak and off-peak services throughout.
“Plans are underway to increase the capacity on Bus Éireann contracted services throughout the country.
“NTA will be introducing a new service between Naas and Blanchardstown and a new Kilkenny city bus service in 2018. All this additional capacity is funded by additional government funding for public service obligation services secured by the Minister for Transport Tourism & Sport, Shane Ross T.D.
The Minister for Transport, Tourism and Sport, Shane Ross TD, has today welcomed the publication by the NTA of passenger numbers for 2017. Minister Ross said the figures demonstrate consistent growth across public transport in Ireland. It is expected that this trend will be sustained in coming years as Ireland’s economy grows.
The Minister added: “The launch of Luas Cross City will add an estimated 10m journeys per year on the Luas network. Continuing to invest in the public transport network is a key priority. €2.7billon will be provided for public transport capital investment over 2018 to 2021. The growth in public transport services has been supported by higher levels of subvention in 2016 and 2017 and will further increase this year. Over the 3 years Public Service Obligation (PSO) subvention will have risen by some 35% in total.”
Public Transport Numbers:
|
|
Dublin Bus | Bus Éireann | Iarnród Éireann | Luas | TOTAL |
| 2010 | 117.05 | 29.13 | 38.23 | 27.53 | 211.94 |
| 2011 | 115.05 | 28.48 | 37.38 | 29.1 | 210.01 |
| 2012 | 113.28 | 28.63 | 36.74 | 29.32 | 207.97 |
| 2013 | 112.49 | 28.64 | 36.74 | 30.51 | 208.38 |
| 2014 | 116.26 | 29.69 | 37.8 | 32.61 | 216.36 |
| 2015 | 119.8 | 30.23 | 39.66 | 34.6 | 224.29 |
| 2016 | 125.3 | 32.1 | 42.8 | 34.1 | 234.3 |
| 2017 | 136.3 | 31.2 | 45.5 | 37.6 | 250.6 |
| Annual growth (m) | 11.00 | -0.90 | 2.70 | 3.50 | 16.30 |
| Annual growth (%) | 8.78 | -2.80 | 6.31 | 10.26 | 6.96 |