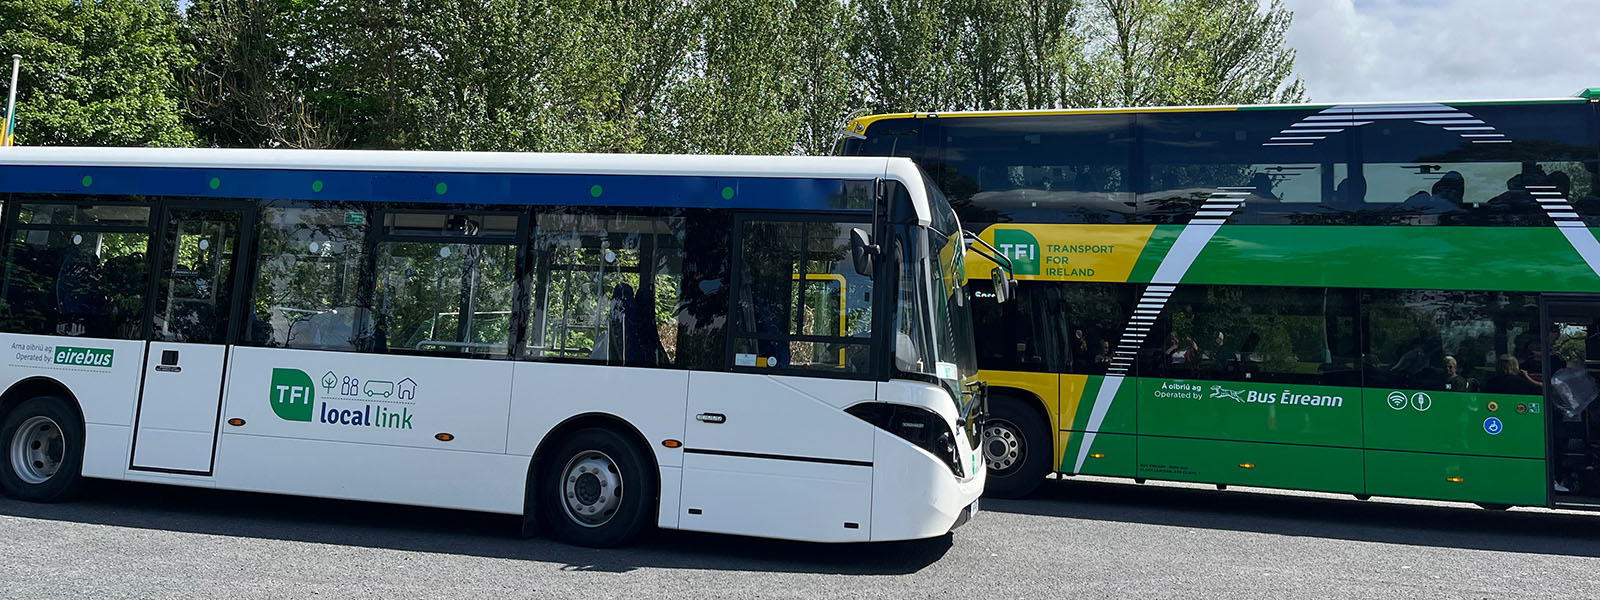
The National Transport Authority (NTA) has developed an interactive dashboard designed to make information on public bus services more accessible and easier to navigate for members of the public. The dashboard provides a clear, user-friendly overview of performance across the main Public Service Obligation (PSO) bus contracts. It brings together key measures, such as punctuality, excess wait time (regularity), and lost kilometres, to give passengers a transparent picture of how bus services are operating.
Dashboard structure
The dashboard is structured to allow users to easily move from a simple, high-level summary into more detailed information. Users can explore performance by service type (low and high frequency routes), examine trends over time, and understand the main causes of service disruption. It also enables users to compare routes and contracts, helping to highlight areas of strong performance as well as those requiring improvement, all in a format designed for ease of use and public accessibility.
Features of the PSO Bus Performance Dashboard
Overall, the dashboard is intended to improve transparency, support informed public understanding of service performance, and make key transport data more readily available. It includes:
- Low Frequency Punctuality: Provides an overview of punctuality performance across low frequency routes. Users can filter by contract, region (Bus Éireann Direct Award Contract only), route, year, and period, and compare performance, including early, late, and on-time departures.
- Detail Low Frequency Punctuality: Offers a detailed table of punctuality performance across all contracts and services, allowing users to explore the data in greater depth.
- High Frequency EWT: Shows Excess Wait Time (EWT) performance across high frequency routes, with filtering options to compare routes and view trends over time.
- Lost KM by Cause Code: Displays kilometres not operated (Lost KMs) alongside the reasons for service disruption (cause codes), helping users understand why services may not have run as scheduled.
- Lost KM Route Comparison: Allows comparison of Lost KM performance across routes or regions, highlighting those with the highest levels of disruption.
- Detail Lost KM: Provides a comprehensive dataset on Lost KM performance across all services, supporting more detailed analysis.
- Definitions: Explains key terms and performance metrics used throughout the dashboard to ensure it is easy for all users to understand the information presented. It is recommended that these definitions are read before navigating through the dashboard.